Our Student's Academic Backgrounds
List of Undergraduate Majors of our Students
- Computer Information Systems
- Mathematics 7-12
- Physics and Chemical Engineering
- Communications
- Anthropology
- Applied Mathematics
- Public Communication
- Physics
- Geography
- Journalism
If you have more questions about whether your background will be a good fit contact us!
I'Jaz Eberhardt

Undergraduate major:
Journalism
Was it difficult to switch from a journalism background to the DSA program?
While I will say I did initially experience a bit of academic “culture shock” in terms of crossing over from an arts-based major to a field in the sciences, most of the difficulties I though I had were self-perceived. I felt that I would be slightly disadvantaged because my background was in journalism as opposed to a more mathematical or technical field, but I actually learned that there were so many ways I could use my type of knowledge and experience to solve quantitative problems in unique ways. I believe the greatest takeaway for any student enrolling in this program who does not have a strong math or science background is to understand that because Data Science and Analytics is interdisciplinary in nature, this is a field that will benefit from all types of backgrounds, including yours, whatever it may be! The key is to not doubt yourself or minimize what you bring to the table.
If someone without a computer science background was applying to the program what advice would you give them?
To understand the curriculum and succeed in this program, I definitely recommend brushing up on your math basics (algebra, calculus, geometry, and statistics) and, if possible, get into some coding (Python and SQL). While you will learn these things at introductory levels in your courses, there are incredible *free* resources at sites like Khan Academy and Coursera that you can utilize to help you along your way or to help you prepare before you even begin your courses in the DSA program.
Also, the number one rule of my journalism background that I’ve found to be just as critical in Data Science and Analytics is to be curious! Asking questions will benefit you greatly. When you don’t understand something, take advantage of office hours with professors and do independent research. Also, you will be dealing with all types of datasets. Take the initiative to delve into them and learn what the data is telling you before you even begin to formulate questions about it. Success is going to be largely based on how involved and interested you are in what you are doing. If you’re inspired, you will ask better questions and find meaningful answers for them.
What, if anything, did you do to prepare yourself for the DSA program?
In preparing, I took some really great advice from my advisor and chair of the DSA program, Dr. Joaquin Carbonara, which was to take a Python coding specialization through Coursera and to get reacquainted with statistics. Because I graduated from my undergrad program in Spring and I began DSA graduate courses in the Fall, I had the summer to devote to studying and learning so that I would go in feeling prepared. I also enrolled in the Intro to Python summer course offered by the DSA program which I would have to say is what prepared me most for my Fall courses.
If you don’t have an entire summer to prepare, or your schedule doesn’t allot you much free time, I would recommend devoting at least one hour a day to watching as many lectures as possible on a subject you feel the least confident in, whether it be coding or some area of mathematics. While the DSA program has extremely knowledgeable and helpful professors who will assist you, the amount of success you will have is ultimately up to you. You have to help yourself in every way you can, starting with identifying your greatest areas of concern and then formulating a plan to address those areas so that you stay on track in your program.
Andrea Khoury

Undergraduate major:
Communications
Was it difficult to switch from communications to data science?
Yes, but I am super glad I did it and I don’t regret it. I went from Marketing/PR all this writing to math and heavy computer science. I did not know much about computers coming into this so it was all new to me. It was challenging and definitely made me out of my comfort zone. I learned a lot of things I never knew before. I think I breezed through my under grad and this masters program was challenging.
If someone without a computer science background was applying to the program what advice would you give them?
I would say yes it is going to be difficult 100% but you will definitely use everything that you learned in undergrad in this program. It will be challenging but it’s going to be beneficial, especially if your interested in it. You have to be interest in it. If you want to do it just to do it because it is the new thing I don’t think you should. But if this is something you enjoy and you think you are interested in it. I say go for it. It is the way the world is leaning right now and there are going to be a lot of jobs it in. You are going to struggle but there is help, you can always get help and you can definitely do it!
What, if anything, did you do to prepare yourself for the DSA program?
I was recommended to take statistics and a computer programming class. The stats class helped, I had never taken stats before, the last time I had taken a math class was my freshman year. So that was definitely 100% great.
James Gravas

Undergraduate major:
Anthropology
Was it difficult to switch from an anthropology background to the DSA program?
I would say it had very minimal challenges in the beginning, but working full-time for the last few years, I have been able to learn many things on the job (Excel, being organized, and professional presentation), so luckily I was well equipped to fit into the program. It was no different than going from an anthropology background into a business profession, so I knew what to expect, but the program is set up to help you succeed, and learn new things along the way.
If someone without a computer science background was applying to the program what advice would you give them?
Definitely familiarize yourself with a programming language (Python, R), basic statistics, and mathematics. Computer science/programming is only a piece of the major. You need to be analytical, and it's important to know that it is not limited to being a computer science major. There isn't anything you can't learn, especially online, which offers countless free resources or inexpensive courses. When learning a programming language, practice makes perfect. Have fun with it, keep reading, keep learning, and you'll do fine.
What, if anything, did you do to prepare yourself for the DSA program?
As mentioned above, I did my research on the field, read articles/books, and learned Python on my own to get a basic understanding. I also made sure it was something I will enjoy doing as a career. I reached out to Dr. Carbonara on my own, and met with him personally to talk a little bit about myself, asked questions about the program, etc. After having that meeting, it gave me a better sense of what was expected of me, so be sure to ask questions.
Examples Student Projects
These projects will give you an idea of some of the tasks that students can complete once they have graduated from the Data Science and Analytics program.
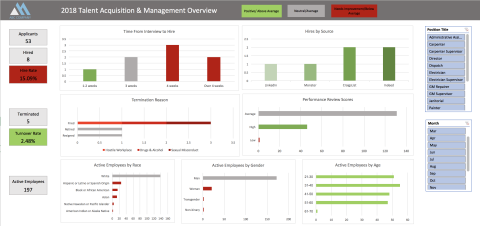
Recruitment Manager Dashboard - Sarah Burke '21
Project summary:

For this project, I created an Excel dashboard for a fictional Human Resources department, specifically a Recruitment Manager. The dashboard is intended to offer the Recruitment Manager actionable insights related to hiring efficiently, hiring quality candidates, and maintaining a diverse workforce. This focus went beyond what was contained in the class-supplied dataset, so I researched and generated the additional data I needed, designed storage for it, and paid special attention to ensuring that the values I generated made sense for the data. For example, employees hired before the year 2000 were assigned different application sources than employees after 2000 when services like Monster and Indeed were created and became more commonplace.
Leading up to the dashboard design, we learned how to design a database, enter the data, answer questions about the data using SQL queries, Excel functions and pivot tables, and then pull it together into a dashboard that follows best practices for layout, readability, and design.
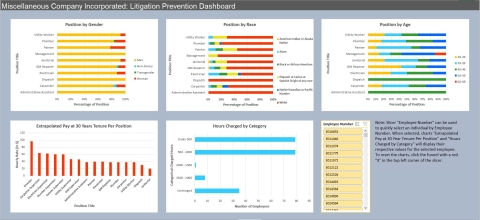
Litigation Prevention Dashboard - Thomas Bidney '21
Project summary:

For this project, I created an Excel dashboard by
direction of the fictional President of HR and Legal Compliance for the usage of those working in the HR department. This fictitious company had received a large influx in lawsuits regarding both discrimination and labor. In connection with discrimination, I created three stacked bar charts to indicate gender, race, and age by position title. This could be used to determine whether the demographic distribution falls within national averages as well as internal review.
I found the US Census data for each applicable position and noted that the ratio for the company fell within those values obtained for the national average. While many groups were underrepresented, the analysis for our company shows they should be protected from litigation. With regards to labor, two charts were created to show an extrapolated pay rate at 30 years tenure per position as well as hours charged by opportunity. Hours charged was used to determine if an employee was being worked longer than the others who log time. For the chart for extrapolated pay, I realized that it was difficult to determine whether an employee was paid fairly in comparison to their coworkers based on the information provided. Simply, comparing employee salaries to the average of that position does not consider the length that an employee had been there. Choosing 30 years as an arbitrary value, I used the formula for compounding interest – with the number of compounds being one per year – to determine what an employee would be paid after 30 years of working for the company. Comparing the averages of this value by position to a specific employee gave a better idea of whether said employee was compensated fairly.
For completing this project, the most important topic to understand was the relationship between tables. With the relationships known, a combination of VLOOKUPs and INDEX/MATCH functions were used in the creation of helper columns. These columns were an easy way to combine relevant data and make the formation of charts easier. After adjusting the tables with helper columns, Pivot Tables were created for answering the questions at hand, such as showing the ratio of provided genders based on position title. Pivot Charts were created from these Pivot Tables to provide real time information in a legible way.
PROGRAMS AND PATHWAYS
Check out what degree or certificate is right for you.
ADMISSIONS
Check out our admission requirements and start your application today.
CONTACT INFORMATION
If you have questions about the program drop us a question and we will be happy to get back to you.

